Building an MQTT Based Telemetry System
A real-time telemetry system can be useful in many situations, for example when building an electric race car. With a telemetry system, we can monitor the status of all of the car systems remotely while the car is driving. The goal was to build a telemetry system that would be simple to use and require minimal maintenance. In this article I go over the telemetry system at Team Spark and describe how you can set it up along with all our code.

Team Spark's 2019 vehicle with the telemetry module behind the head restraint
The system is client-server based. A Raspberry Pi client is mounted in the vehicle, which reads measurements from the car CAN bus network and sends them to a server over mobile broadband (LTE/4G) using the MQTT protocol. The server hosts an MQTT broker along with two web services for viewing the data. This way we can view the data in real-time from the pit, the spectator stand, or the other side of the world.
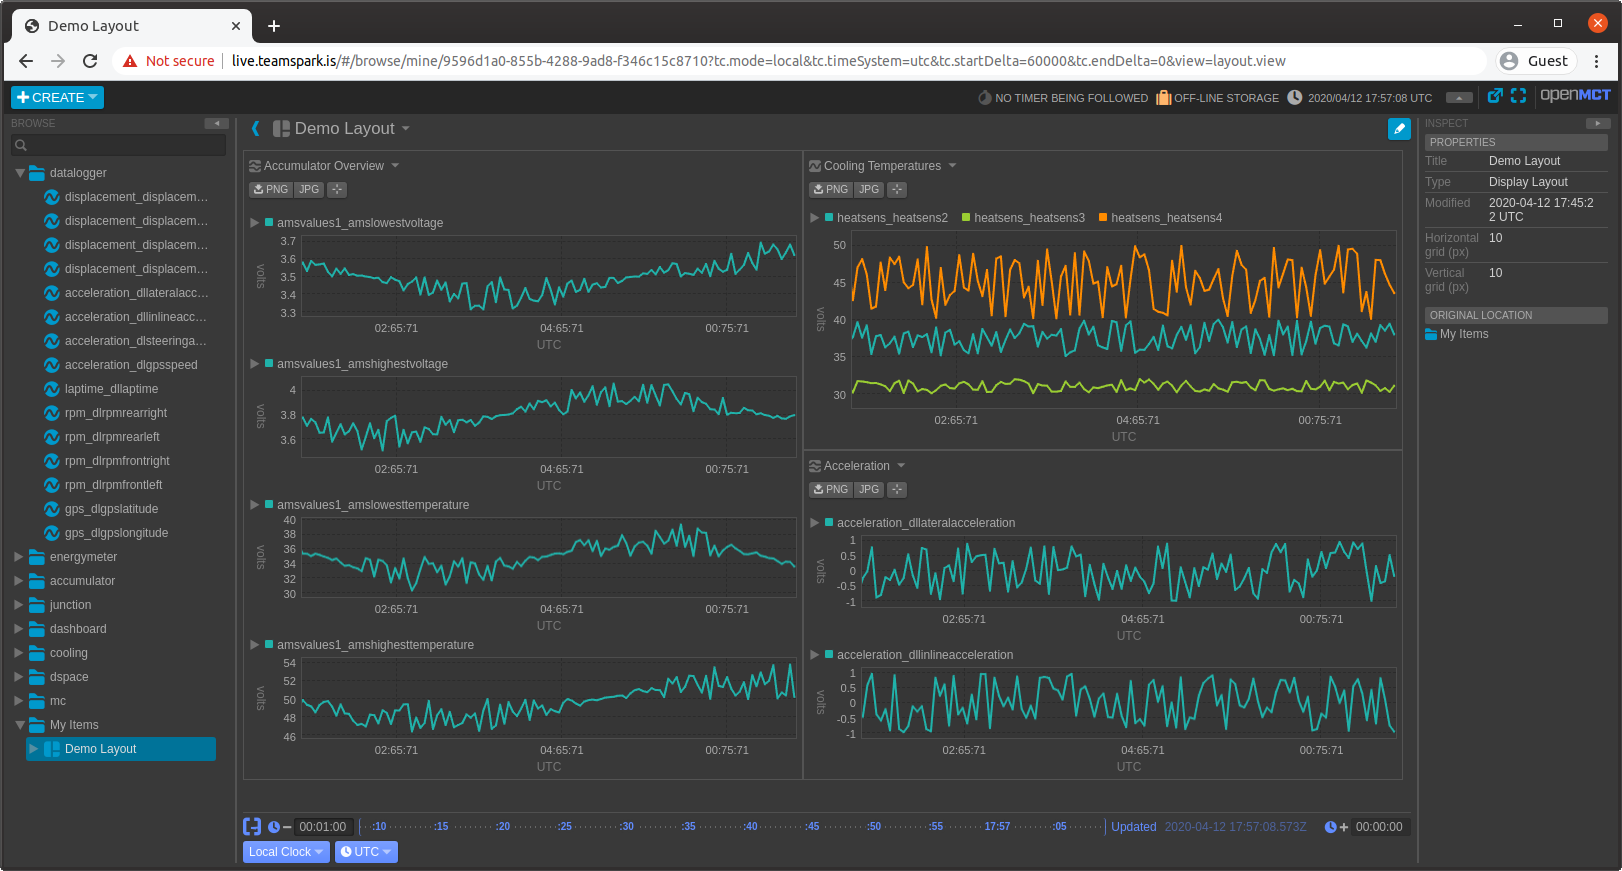
The OpenMCT front-end with live telemetry
The first service is based on OpenMCT, a real-time data visualization framework from NASA, where users can select the measurements they want to view and build custom layouts. OpenMCT has many cool features such as zooming in and freezing the graphs. It also persists the data so that when the page is refreshed (or visited for the first time) older data points are also shown.
You can see our OpenMCT front-end here!
The second service is Mission Control. It is also web-based and holds features that don’t fit well into OpenMCT. It can show an overview of the accumulator with every cell voltage and temperature, and also the overall status. It can also show a list of every sensor with their current value and sample rate. Finally it can be used to upload CAN bus configuration (see DBC files in the next section).

Diagram showing the system structure
You can find all the code in the following GitHub repositories:
- Client software: can-mqtt-bridge
- OpenMCT, InfluxDB and Mosquitto bundle: cbeam-telemetry-server
- Mission Control: mission-control
Getting Started
This tutorial will start by looking at the protocols used. Then go over how to set up the server side. Then show how to set up the client hardware, and finally how to get client program to run on the Raspberry Pi. We will also go over how to set up a VPN connection to the Pi and how to debug the system.
To use the telemetry system you will need to have a vehicle with a CAN bus network. You will also need the following components, which are all pretty cheap.
- A Raspberry Pi (preferrably 3B+ or newer)
- A voltage regulator to power the Pi from the vehicle
- An SPI module for CAN bus (for example an MCP2515 module)
- A USB mobile modem for internet (we use Huawei E8372h)
- A mobile SIM card for internet.
- A server capable of running linux (for example a cheap VPS)
The Protocols
Before we continue, here is a brief introduction to the protocols that we use.
MQTT
MQTT is a lightweight network protocol widely used in IoT and mobile
applications. For example Facebook Messenger uses MQTT to transmit messages.
Clients connect to an MQTT broker (hosted on a server) and can either publish or
subscribe to specific topics. Say client A is subscribed to the topic
car/motor/temperature, and a while later client B publishes a value 30.4 to
that topic. Then the broker will forward the value 30.4 to everyone subscribed
to that topic including client A.
The broker that we use on our server is called mosquitto. It also includes command line tools to publish and subscribe to a given topic on a broker. If you want to try out MQTT you can use the testing broker test.mosquitto.org.
If you’re running Ubuntu, open a terminal and install the mosquitto clients.
$ sudo apt update
$ sudo apt install mosquitto-clients
We can subscribe to our topic with the following command.
$ mosquitto_sub -h test.mosquitto.org -t 'car/motor/temperature' -v
Now we open a second terminal and publish a few messages to our topic.
$ mosquitto_pub -h test.mosquitto.org -t 'car/motor/temperature' -m 30.4
$ mosquitto_pub -h test.mosquitto.org -t 'car/motor/temperature' -m 32.0
We can see in our first terminal that we recieved the values.
$ mosquitto_sub -h test.mosquitto.org -t 'car/motor/temperature' -v
car/motor/temperature 30.4
car/motor/temperature 32.0
CAN bus
CAN bus is a communications protocol widely used in motor vehicles and embedded systems. There are several versions of the standard, the one we use is CAN 2.0 although all our software should be compatible with CAN FD as well. CAN bus messages are sent as frames. where each frame has an 11 bit identifier, and 1-8 bytes of data. The identifier is usually represented as a 3 character hexadecimal value and tells you where the message is coming from.
In our vehicle, all the systems send their measurements to the same CAN network. For example the accumulator uses 72 different identifiers for sending the voltage and temperatures of each cell. To keep track of which sensors the CAN identifiers correspond to, we use a database format called DBC. The program we use to manage our DBC database file is Vector CANdb++ which can be downloaded for free.
If we connect our computer to a CAN network, for example with a CAN-USB
interface, we can see a stream of frames being sent on the network. Here is an
example where we have connected our computer to a CAN network, and use the
candump tool to see all the traffic (see the client section for more details).
$ candump can0
can0  430 [8] 00 0B 3B 9F 03 02 04 5A
can0  240 [6] 01 A1 12 19
can0  431 [8] FF FF A9 3F 18 A8 C6 28
can0  430 [8] 00 C0 53 7A FF 7F FF FF
can0  431 [8] FF FF FF 60 01 FF FF FF
can0  430 [8] 00 1B 01 E0 53 7F 10 3F
Each line here is a CAN frame. We can see the 3 digit identifier, and then the
bytes. But without any context we don’t know what the bytes represent, that’s
why we use a DBC database. The DBC file describes the contents of each
identifier, so that we can decode the raw bytes to the actual measurements. For
example the DBC file might specify a message named “GPS measurements” with
identifier 0x240 that should be 4 bytes long and contain two measurements
“Latitude” and “Longitude”, each a 16 bit unsigned integer.
Setting up the Server
In this part we will set up all the server-side software. You will need to have some experience working on a linux command line to follow this guide. Luckily there is an abundance of tutorials online if you need any help.
First order of business is to set up a server. For example you can use a VPS provider such as DigitalOcean or Hetzner, ranging from 5 USD per month. As this is a farily lightweight application, 1 CPU core and 1 GB of RAM should be fine. I recommend using an LTS version of Ubuntu Server.
Setting up Docker
When you have a server that you can connect to using SSH, along with sudo privileges, we can continue. First we need to install Docker. There is no Docker package in the official Ubuntu repositories so we need to take a few extra steps (see their docs here)
First install the packages needed to add the Docker repository (we also need git later so I sneak it in here)
$ sudo apt update
$ sudo apt install apt-transport-https ca-certificates curl gnupg-agent \
    software-properties-common git
Now add the Docker GPG key and add their repository.
$ curl -fsSL https://download.docker.com/linux/ubuntu/gpg | sudo apt-key add -
$ sudo add-apt-repository \
    "deb [arch=amd64] https://download.docker.com/linux/ubuntu \
    $(lsb_release -cs) \
    stable"
Now we can update the apt package index and install Docker
$ sudo apt-get update
$ sudo apt-get install docker-ce docker-ce-cli containerd.io docker-compose
Verify that Docker is correctly installed by running the hello-world image
$ sudo docker run hello-world
Setting up the Telemetry Stack
Our telemetry server stack runs completely within Docker containers and it can be installed with only a few commands, making these few extra steps well worth the effort.
Start off by cloning the cbeam-telemetry-server into your home directory.
$ git clone https://github.com/Ingimarsson/cbeam-telemetry-server.git
This repo contains a docker-compose.yml file, which tells Docker exactly how
to set up our stack. We will have three containers running afterwards.
- mosquitto: the MQTT broker
- InfluxDB: a time series database for retrieving historical data
- cbeam-telemetry-server: a web server that hosts OpenMCT
Before we can start the containers we need to configure a few things. We will need the mosquitto utilities so let’s install them
$ sudo apt install mosquitto-clients
The mosquitto configuration is stored in the mosquitto/ directory. It is
configured to allow anonymous users to connect and subscribe to topics. But only
the user telemetry can publish data. Let’s create a password for this user.
$ cd ~/cbeam-telemetry-server/mosquitto/
$ mosquitto_passwd -c mosquitto.passwd telemetry
We also need to configure which MQTT topics should be available in OpenMCT and
how they should be organized. The folders in the OpenMCT sidebar are called
dictionaries and they contain one or more measurements. This configuration is
stored in dict/dictionaries.json which already has an example config to get
you started. In the next section (Mission Control) we go over how we can
auto-generate this config from the DBC file.
Assuming you have finished this configuration, we can create the containers. This command will take a while.
$ cd ~/cbeam-telemetry-server/
$ sudo docker-compose up --build -d
When this is finished, we should have all three containers running. Try opening
http://server-ip:8080/ in your browser and you should see OpenMCT. It’s a good
idea to see if values from MQTT are received by the front-end like I do in the
screenshot below.
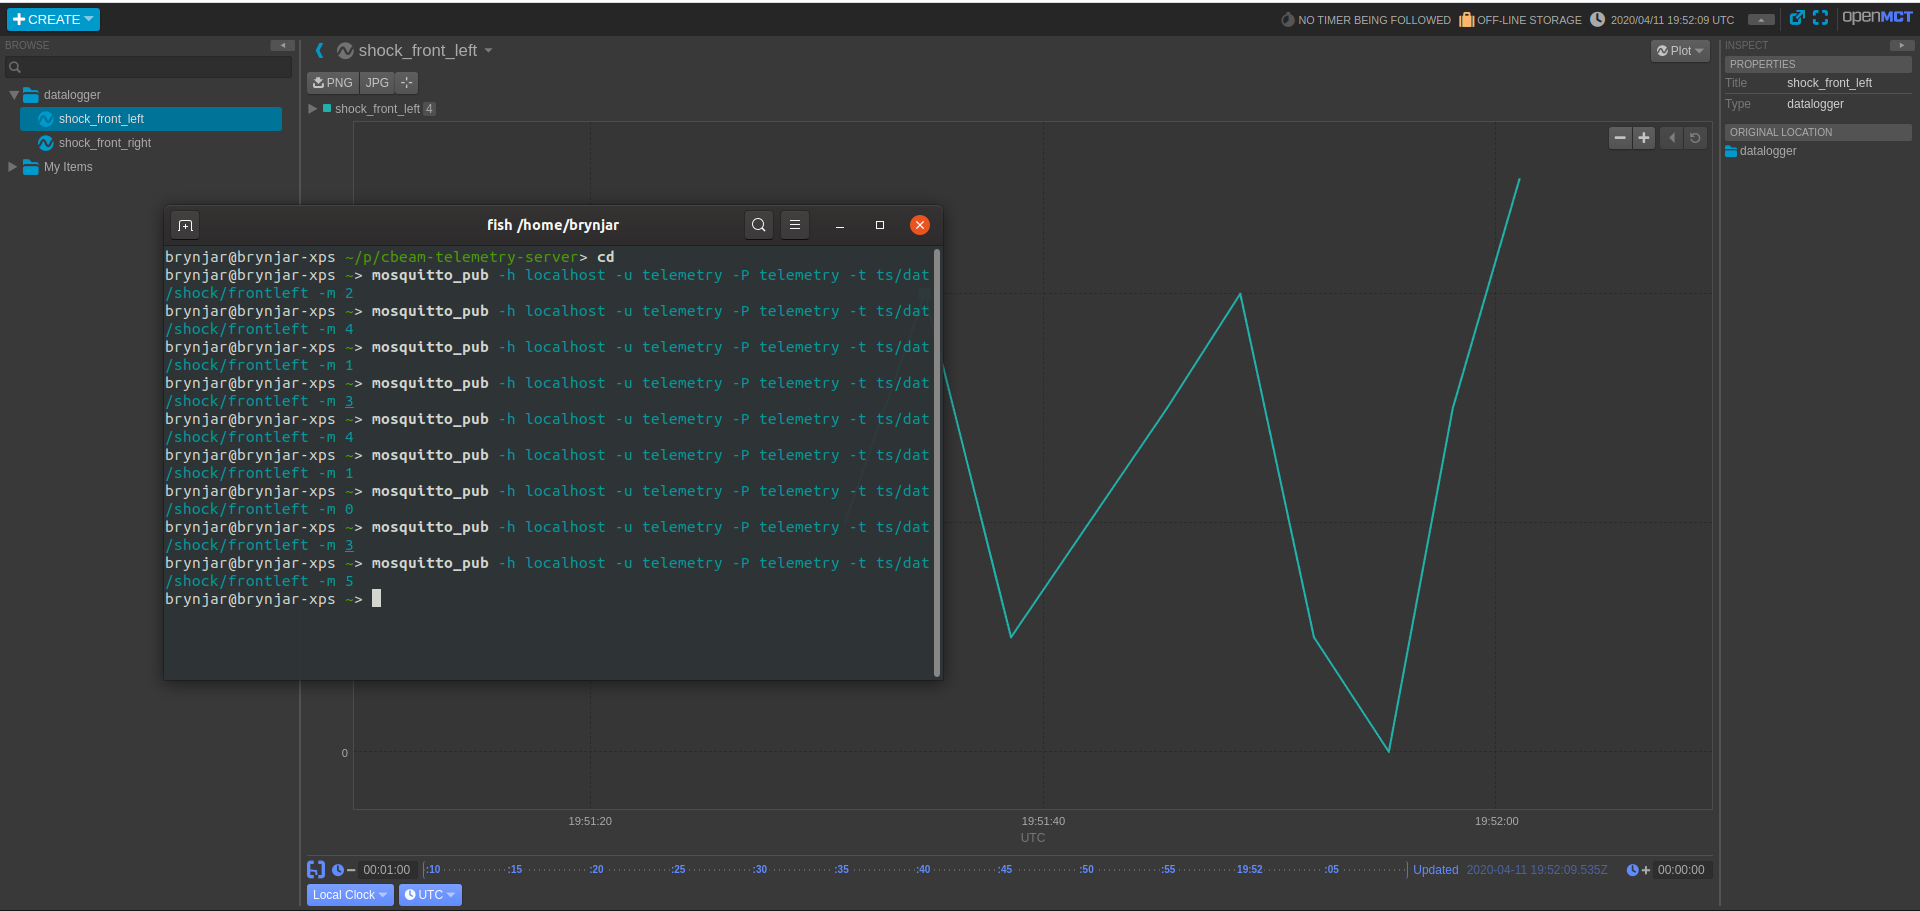
OpenMCT displays data sent over MQTT
If you can’t connect to OpenMCT on port 8080, check the Docker logs for any errors.
$ sudo docker logs cbeam-telemetry-server
The first time starting the containers, you might see an error with connecting to InfluxDB (port 8086) or about the dict file not being accessible. In both cases a restart should do the trick.
$ sudo docker restart cbeam-telemetry-server
You might also have connection problems if your server is behind a firewall so make sure that the relevant ports are open.
Storing MQTT topics in the DBC file
We can now configure the MQTT topics that OpenMCT should show in the
dict/dictionaries.json file. But it would be more practical to keep all
configuration in the DBC file. What we do is we write the MQTT topic in the
comment field of each signal in the DBC file. Then we use the DBC as the config
on both the server and the client.
You might want to define some structure for MQTT topics, for example
<car>/<system>/<group>/<sensor>. Then we might have topics such as
ts19/accumulator/voltage/62 or ts19/cooling/fanspeed/1, but it’s up to you
how strictly you follow the rules.
The client program will read the MQTT topic from the DBC comment field to know
where to send the decoded measurement. We then need to write a corresponding
dict/dictionaries.json so that all measurements can be seen in OpenMCT. There
is a Python script in bla/bla.py to convert the DBC file to JSON. Assuming you
have a DBC file ready, you can upload it to the server and run the following
command.
$ python3 dbctojson.py database.dbc > dictionaries.json
The OpenMCT service is written so that it restarts when a change to this file is detected. But if it doesn’t you will have to restart OpenMCT to use the new config.
$ sudo docker-compose restart -d
If you also set up Mission Control (see next section) then you can upload the DBC file there and OpenMCT will be restarted automatically. That makes the system a bit more user friendly.
Setting up Mission Control (Optional)
You should now have a fully functional telemetry stack and could go straight to setting up the client. Mission Control is a custom service that I wrote for additional features that didn’t fit well into OpenMCT.
Setting up NGINX as a Reverse Proxy (Optional)
$ curl ifconfig.me
82.221.92.68
Security
Currently all our services are using unencryped protocols and our front-end is open to the public. If security is a concern for you, consider setting up SSL certificates for the HTTP, WebSockets and MQTT services. This requires additional configuration that I will not cover here.
Relevant book
If you need even more security and don’t want the front-end to be open to the public, you might consider running everything behind a VPN network with only the server, client and computers that need access to the front-end. Check out OpenVPN and WireGuard for this.
Building the Client Hardware
As we wanted to keep our solution simple, we decided to use a Raspberry Pi. It has
To build the hardware client you will need the following parts
- A Raspberry Pi (most versions will work, we use RPi 4)
- A voltage regulator to supply power to the Raspberry Pi
- An SPI module for CAN bus (for example an MCP2515 module)
- A USB mobile modem for internet (we use Huawei E8372h)
We decided to design a custom PCB for the power supply and CAN module to make our system more reliable and compact. This is mounted in a waterproof enclosure that is mounted on the back of the driver’s head rest.
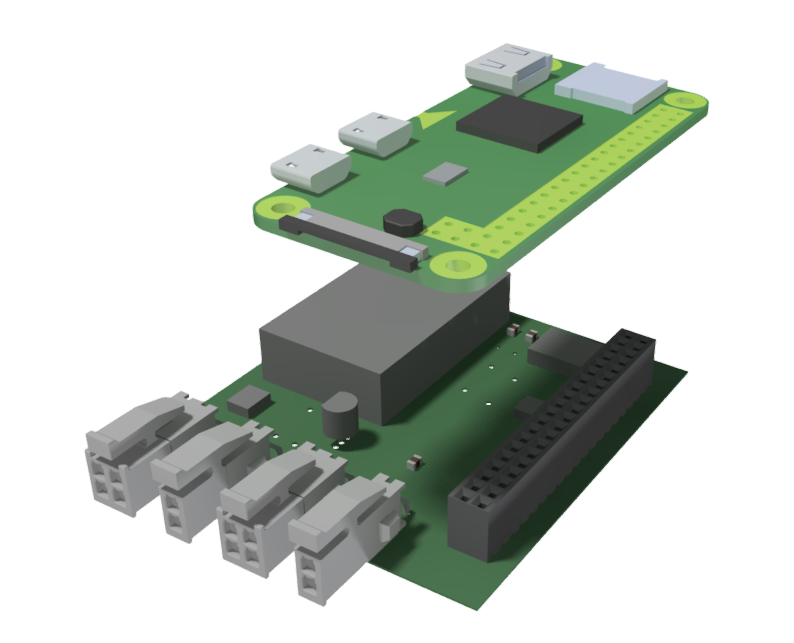
The telemetry PCB with RPi attached
Setting up the CAN Interface
I recommend installing the can-utils package so that you can debug the CAN bus from the command line. The following programs are particularily useful.
- candump - print out all incoming can packets
- cansend - send a can packet
- canbusload - calculate the traffic on the can bus
Using can-utils
Install the tools with the following commands.
$ sudo apt update
$ sudo apt install can-utils
Now we can see all the messages being sent on the CAN bus.
$ candump can0
  can0  420   [8]  12 34 12 34 43 21 43 21
  can0  410   [2]  FF E1
  can0  420   [8]  12 34 12 34 43 21 43 21
We can also send a message with the following command.
$ cansend can0 420#1234123443214321
Finally we see the current CAN bus load percentage (current/maximum bandwidth)
$ canbusload can0
Installing the Client Program
To send data from CAN to the MQTT broker, I wrote the command line program can-mqtt-bridge in C++ as decoding CAN frames can be quite CPU intensive. We can compile the program with the following commands (the script also compiles dependencies, just sit back and relax)
$ git clone https://github.com/Ingimarsson/can-mqtt-bridge.git
$ sh install.sh
$ make
$ make install
Now we can see if the program actually works. Replace the MQTT host, username and password with your own in the command below.
$ can-mqtt-bridge -d can.dbc -H mqtt.teamspark.is -U admin -P 123 -v can0
[2020-03-21 01:27:19] using DBC file can.dbc
[2020-03-21 01:27:19] no frequency limit specified
[2020-03-21 01:27:19] using MQTT host mqtt.teamspark.is:1883
[2020-03-21 01:27:21] spark/ams/temp/1 13.330000
[2020-03-21 01:27:21] spark/ams/temp/2 13.330000
Here I sent a CAN frame with identifier 0x401 (battery temperatures) and we
can see that the values were decoded according to the DBC file and published to
the topics specified in the DBC comment field.
Configuration
We also want the system to be easy to use. Ideally the Raspberry Pi should start forwarding CAN messages to the server as soon as it is turned on, without having to open a shell and type some commands. For this reason we should run can-mqtt-bridge as a background service that starts automatically on boot.
Setting up a VPN
It can be convenient to be able to SSH into the Raspberry at any time. Since it’s usually not possible to forward ports on mobile connections, we need to use a VPN. The service we use is Zerotier. You can create a virtual network for free and connect up to a 100 devices. It might also be worth checking out Tailscale if you don’t like Zerotier.
Next Steps
Contributions
- Kristján Örn Aðalbjörnsson
- Valtýr Örn Kjartansson
- Guðni Már Gilbert
- Heiðar Már Þráinsson